The concept of lease-up and stabilization is the source of many recurring questions in commercial real estate disputes. Was the developer’s projected lease-up timeline reasonable when it was made? Did market conditions explain why the building took longer to fill than the pro forma anticipated? What would the property have earned if not for the defect, breach, or casualty, and when would it have reached stabilization? Each of these questions is answered through a careful analysis of how a building moves from delivery to full occupancy, and each demands more than any single number can generally provide.
These questions surface across a wide array of CRE disputes. In construction defect cases, lease-up analysis determines how long a building will sit partially or fully vacant during and after remediation, directly feeding into lost profits calculations. In partnership disputes, the spread between actual and projected lease-up drives claims that the managing partner’s assumptions were unreasonable or self-serving. In construction loan defaults, lenders and borrowers contest whether absorption timelines built into loan agreements were achievable given market conditions at delivery.
The Limits of a Single-Number Metric
The standard analytical response to these questions is to cite a net absorption figure from a market report. In our view, that response is inadequate. Net absorption is a market-level, backward-looking, single-number metric that does not take the highly nuanced nature of real estate into account. On the surface, it informs how much space a market consumed the previous quarter. It does not tell you how long a specific building will take to reach stabilized occupancy, what concessions it will need to offer, which types of units it will lease first, or what the economic result of a prolonged lease-up period entails.
The problem is more nuanced than aggregation. When a newly delivered building leases a unit, the tenant often comes from an existing building in the same market. The new building records a move-in, the old building records a move-out. At the market level, those two events cancel: net absorption does not change. Yet the new building’s lease-up is progressing, the old building’s vacancy is rising, and the competitive dynamics between the two are reshaping rents, concession activity, and tenant expectations across the market. Net absorption fails to capture any of these nuances. It was designed to measure whether a market was gaining or losing tenants in the aggregate, not to describe the supply and demand dynamics that determine how quickly a specific building might fill, at what rents, and at whose expense.
The underlying economics are straightforward. Each new delivery shifts the supply curve for the market outward. If demand has not shifted proportionally, the new equilibrium settles at a lower rent, a higher vacancy rate, or sometimes both. The newly delivered building enters a market where its own arrival has changed the competitive conditions it faces. The more units that are delivered within the same window, the further the supply curve shifts, and the more the building must compete on price, concessions, or amenities to attract tenants away from existing stock. Buildings do not absorb into a fixed demand environment.
The Numbers Behind the Gap: Eight Years of U.S. Multifamily
A more useful diagnostic than headline absorption is the absorption-to-delivery ratio, calculated as net absorption divided by net deliveries over a matching period. A ratio below 100% is the market-level signature of supply overhang. The metric scales absorption by the supply it must clear, which is the adjustment that headline absorption figures omit.
We measured this across seven major U.S. multifamily markets over the 2018-2025 window, a deliberately long lens that spans pre-pandemic conditions, the pandemic shock, and the recovery that followed. The pattern is striking.
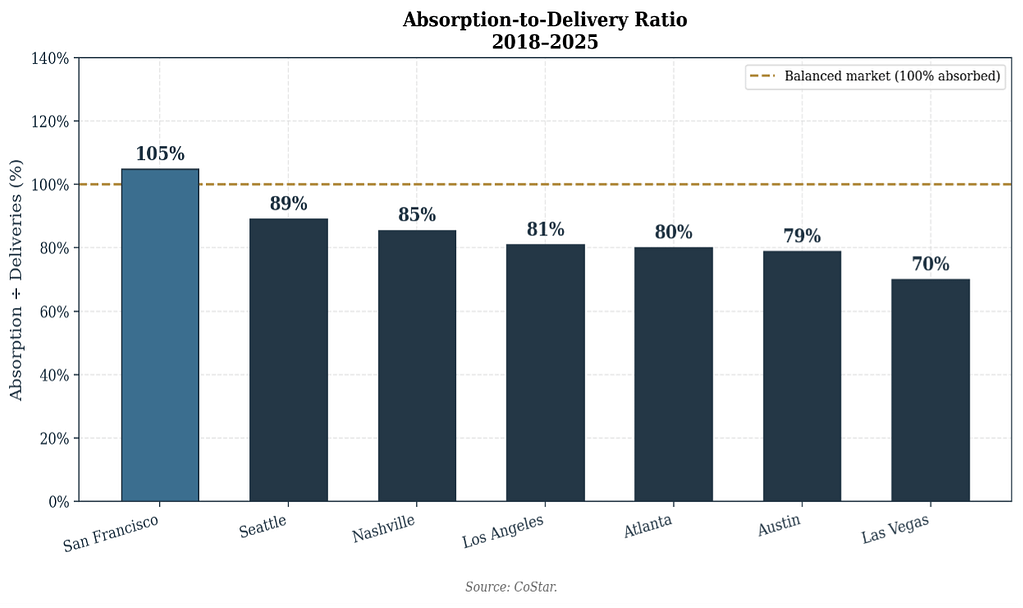
San Francisco and Chicago absorbed more than 100% of what was delivered over the eight-year window. They are constrained-supply gateways that re-absorbed units vacated during the pandemic. The Sun Belt looks very different. Even averaged across eight years of mixed conditions, four major Sun Belt markets absorbed less than 85% of what was built, and Las Vegas absorbed only 70%. That gap is invisible in the quarterly absorption figures most market reports lead with, because those reports do not scale absorption by the supply that arrived alongside it.
In markets experiencing development booms, quarterly net absorption can be strongly positive while still failing to keep pace with deliveries. Markets such as Austin, Phoenix, and Nashville posted historically strong absolute absorption numbers between 2021 and 2024 while simultaneously experiencing rising vacancy rates, because the supply pipeline outpaced even record demand. Net absorption alone would have told you the market was healthy. The buildings being delivered into that market would have told you something different.
Why This Matters in Litigation
In litigation, the question is rarely “what did the market do” in the aggregate. It is “what should this specific building have done in the market it was delivering into.” Those are different questions, and they often have different answers. A developer who delivered a building into a 70% absorption-to-delivery environment faces a fundamentally different defense of a 12-month stabilization projection than a developer who delivered into a 100% environment. A lender enforcing a covenant tied to “market absorption” needs to know which market, measured how, and against what supply backdrop.
Cited without context, net absorption can be made to defend almost any position. Cited with the absorption-to-delivery ratio and a clear view of the supply environment, the same data tells a much more specific and defensible story. The diagnostic that goes into the analysis matters as much as the conclusion that comes out.
Why Precise Analysis Matters
Resolving complex CRE disputes requires more than a quick citation of net absorption from a market report. It demands a rigorous analysis of supply against demand, the appropriate scale of measurement, and the property-specific factors that drive a building’s actual lease-up trajectory. Grayslake Advisors brings this level of clarity to opaque transactions. Whether a matter involves construction defect lost profits, partnership disputes, or loan covenant claims, our work translates complex market data into defensible, evidence-backed conclusions for litigators and the courts.