“Market absorption” is a scale-dependent figure. National multifamily absorption, downtown submarket absorption, and building-level absorption are three distinct measures produced by three different data infrastructures, and they can diverge for the same period. Two experts citing “the market” can both be accurate and reach opposite conclusions if the scale of each expert’s measure does not match the scale of the question before the court. The first analytical duty, before any curve is fit or any number is cited, is to confirm that the geography, product segment, and time frame of the measure align with the property and the dispute.
The Economic Logic of Scale-Dependent Numbers
Market reports aggregate absorption across hundreds or thousands of buildings within a geography, producing a number that describes the leasing environment on average. It says nothing about how a specific building is performing within that environment. A submarket reporting 6% vacancy can contain a newly delivered building stuck at 40% vacancy, just as a submarket at 18% vacancy can contain a stabilized building running at 4%. The aggregation that produces a clean market number washes out exactly the property-level performance that is important in the nuanced nature of litigation.
Compounding this is the choice of geography. The same metro measured at two scales can yield very different answers. A downtown submarket and the broader metro that contains it are subject to different supply, different employment bases, and different tenant pools. They can tell opposite stories about the same window.
The Numbers Behind: Downtown vs. Metro, 2022-2025
We measured the 2022-2025 absorption-to-delivery ratio for four named multifamily markets at two different geographic scales: the downtown submarket only, and the broader metro that contains it. The same period, same market, measured two ways, produced material differences in three of the four cases.
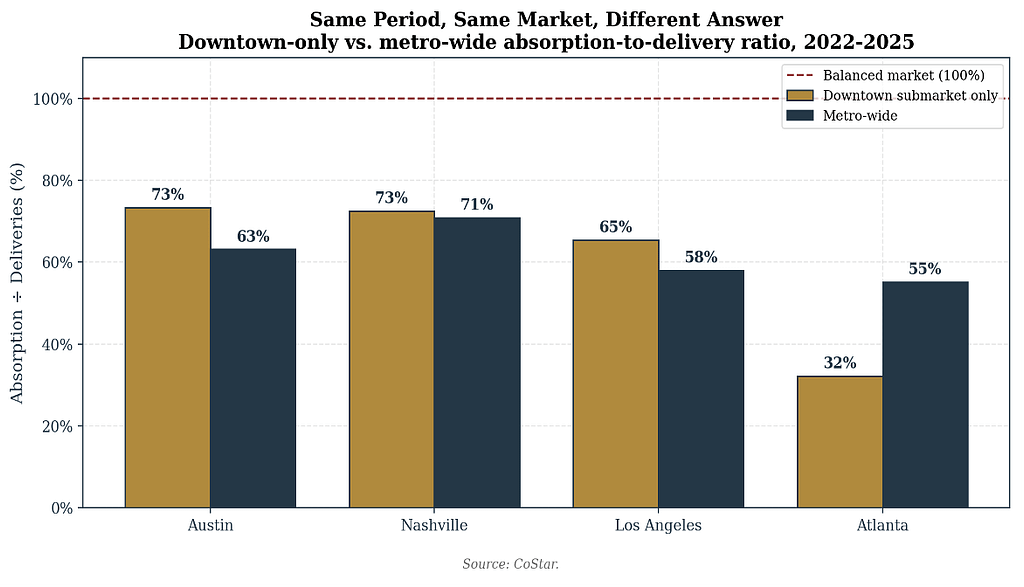
Atlanta downtown absorbed roughly a third of its 2022-2025 deliveries while the broader Atlanta metro absorbed more than half. Both figures are accurate. Both describe “Atlanta.” But they describe different buildings competing in different supply environments. The reverse pattern shows up in Austin, where downtown absorbed 73% of deliveries while the broader metro absorbed 63%. Downtown actually outperformed the rest of the market.
An expert citing “Atlanta multifamily” to defend a 2024 projection has to specify which Atlanta. A market-level number applied to a building that does not resemble its market is not a benchmark.
When Asking Rent Lies: The Concession Problem
A second commonly missed dimension is concession activity. A building that reaches 90% occupancy in 10 months by offering three months of free rent on every lease has achieved rapid physical absorption but has not achieved economic stabilization. Its effective rent per occupied unit is below asking rent for the first year of each lease, and the revenue generated is lower than what was on the stabilized pro forma. Yet concession data is rarely reported in market reports and is almost never incorporated into published absorption benchmarks.
During lease-up, asking rent is a poor proxy for the price at which units actually transact. The margin of adjustment is the concession. Operators discount effective rent through concessions well before they mark down asking rent, so the concession series captures pricing weakness that the asking-rent series does not.
The Numbers Behind: Downtown Austin Class A, 2022-2025
Downtown Austin Class A multifamily illustrates the pattern. Between 2022 and 2025, asking rent held inside a narrow band of roughly $3,700 to $4,000 per unit, a range of approximately 8%. Over the same window, effective-rent concessions climbed from under 1% to a peak of 3.8%, and submarket Class A vacancy rose to 28.4% in 2024 Q1.

The face-rent series records a market in which rents were stable. The concession series, paired with the vacancy data, records a market in which the price a landlord realized fell by roughly three percentage points of rent while vacancy nearly doubled. An expert who models revenue off asking rent during lease-up, in a market of this character, will overstate stabilized NOI by approximately the concession differential.
Geography and concessions are two distinct lenses, but they share a common feature. Each reveals a gap between the market number that gets cited and the property-level reality that determines a building’s actual economics. In disputes, the gap between those two numbers is often the gap between a defensible damages position and a flawed one.
Why Precise Analysis Matters
Market reports are useful directional indicators. They are also routinely cited in disputes as if they answered questions they were not designed to answer. The first analytical duty, before any number is cited, is to confirm that the geography, product segment, and pricing layer of the measure align with the property and the dispute. Grayslake Advisors brings this level of clarity to opaque transactions. Whether a matter involves valuation, lost profits, or a counterfactual lease-up scenario, our work translates complex real estate data into defensible, evidence-backed conclusions for litigators and the courts.